e-tourism and marketing

A large majority of tourism goes on vacation with his smart-phone or tablet in the luggage, and abandoned more conventional urban cards in favor of applications 2D such as googlemaps etc.

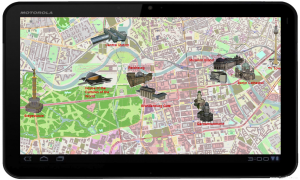
Tourist map of Berlin in augmented reality - source: Yasmin Dadas

Tourist map of Berlin in augmented reality – source: Yasmin Dadas

The use of 3D city model and building on mobile internal model rest him fairly low despite its significant potential (navigation in the buildings, information and marketing geo-located etc…). With the progress of the technology of streaming 3D models expected the next few years, e-tourism and e-marketing should know soon a boom. Using sensors in mobile devices, the user will be able to be guided in buildings using augmented reality, receiving tourist information and relevant trade offers related to its position, virtually explore places that are inaccessible or missing today.

Prerequisite: Model of 3D city (LoD2, or even LoD4 for inland navigation), tracking.

Initiatives & contacts

Augmented Reality Tourist Map Application of Berlin

Company Darts

Microsoft Hololens


Wind turbines integration near homes

Planning a wind farm is a long process that can last from 3 to 5 years, from the identification of a location with good wind potential in the construction. The impact study and the acceptance of the population local affected by the project is takes an essential place.

Collaborative planning of wind farm. Source: project 3d - screws

Collaborative planning of wind farm. Source: project 3d – screws

In this context, 3D city models provide an excellent support simulation and communication, whether for analysis of the surrounding noise, shading or the visibility from the point of view of the surrounding homes.

Residents may have thus a realistic impression of what awaits them, and be able to find the best solution with the developer of the project who will settle any conflicts and concerns.

Of course, such studies of impacts are not limited to wind turbines. They apply to other many construction projects, such as a high-voltage line, a dam or a tower in the city centre… everywhere where transparency and local acceptance plays a vital role.

Prerequisites: City 3D (LoD1 enough) and model field.

Initiatives & links

Project 3D – SCREWS


Estimation of urban heat and cooling demands

Combining data spatial and semantic, 3D city models provide excellent support to calculate the needs of heating and cold of the buildings at the urban scale, giving a rating by building much more reliable and realistic than the traditional method based on 2D - GIS maps.

Specific needs of heat in an area of Ludwigburg - source: HfT Stuttgart

Specific needs of heat in an area of Ludwigburg - source: HfT Stuttgart

  They allow in particular to calculate individually the orientation of the facades and volumes of each building, essential information for thermal modeling of buildings. The data collected on the construction of the fassades, roof and window as well as on the use of the building can be stored, via the CityGML Energy ADE urban information model. The missing data is generally estimated based on the type and age of the building, through specialized bookshops.   The uncertainty in the estimation of the heat of the building needs depends directly on the quality of the information collected. A study comparing simulation and heat consumption measures revealed deviations from the order of 20% or less when rich semantic data were collected, and beyond 30% otherwise.   Beyond the simple fact to model the existing thermal state of the buildings, this methodology allows also to predict energy savings related to the renovation operation on an urban scale, whether at the level of the district, the city, or even in the region.

Prerequisite: 3D city model (LoD1 and LoD2) generally, function and age of each building, energy renovation operation, vacant buildings.

Initiatives & links

SIMSTADT, urban energy simulation platform

  • Some applications for quarters of Karlsruhe, Ludwigsburg, and Rotterdam, between 200 and 1000 buildings.
  • Estimated needs of heat and CO2 emission scenarios of renovation of ~ 1000 buildings of the district Bospolder of Rotterdam (report), the project of European Music.
  • Contacts: New Roman, Volker Coors (HFT Stuttgart).

Territory of the County of Ludwigsburg climate energy plan

  • Klimaschutzkonzept (map energy climate territory) of the 32 municipalities of the County of Ludwigsburg (500,000 inhabitants)
  • Partners: HFT Stuttgart, Drees & Sommer, Landkreis Ludwigsburg
  • Contacts: Volker Coors, New Roman (HFT Stuttgart).

"Citywide urban building energy model" Boston

  • Estimation of hourly applications for gas and electricity to each of the 100,000 buildings in the city of Boston
  • Contacts: Christoph Reinhart, Carlos Cerezo (MIT).

Project Sunshine

Noise propagation and mapping

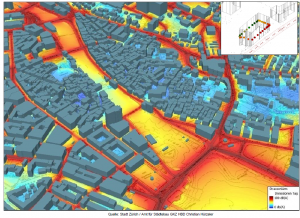
3D city models combined with the digital terrain models (DGM) offers a data base adequate to the calculations of propagation of sound waves in urban areas.Map of Zurich noise - Source: City of Zurich

Map of Zurich noise – Source: City of Zurich

  Such studies are required in particular by the European 2002/49/EG directive on noise in the environment to assess the levels of noise pollution and implement the necessary improvement actions. The agglomerations of more than 100.000 inhabitants are required to perform such studies every 5 years.

For new urban development, this method based on 3D models to optimize plotted of the axes of transport and urban forms in order to limit noise pollution.

Prerequisite: model 3D city (enough LoD1) including DGM, data traffic, railroad and air as well as from industrial activities. Optionally: Data for construction of buildings and urban infrastructure (in particular their reverberation coefficient).

Energy (pre)certification of the housing stock

Diagnostics of energy performance (DPE) are in France as in most European countries mandatory for all housing for sale or rent. They consist in particular of a label energy ranging from A and G on a scale of energy performance of housing. Concretely, a Certified Professional (Afnor etc.) comes on the spot, check the mode of construction, notes some information about the positioning and the geometry of the building (joint ownership, orientation, available to the openings), heating and ventilation equipment, and returned all of this in his accredited software that will generated a note between A and G, more or less reliable according to the accuracy of the information (depending on the limited time of the Diagnostician).
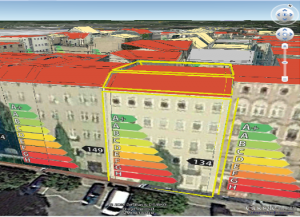
 

Energy Atlas Berlin - source: TU Berlin

Energy Atlas Berlin – source: TU Berlin

3D city models are not intended to replace these diagnosticians but can provide specific information and save valuable time, providing the exact geometry of the building (as well as the location of the windows for building LoD3 models or more) and certain information such as the year of construction renovation of the building. Based on the available data, a pre-certification energy using the normative calculation of ECD engine can be achieved without legal value but which can be refined by the Diagnostician by collecting additional targeted information.


In the Netherlands, this process of pre-certification is applied to all buildings in the country, which systematically receive a "energielabel", released via an online GIS.  If no Diagnostician came to check the energy level of the building, this label will be based simply type and age of the building, generally underestimating the real efficiency of the building to encourage owners to review this note by default by calling a professional.

Prerequisite: CityGML at least, data construction LoD2 (possibly deduisible of the age and the type of building) and energy systems.

Initiatives & contacts

Urban energy simulation platform SimStadt

  • Some applications for quarters of Karlsruhe, Ludwigsburg, and Rotterdam, between 200 and 1000 buildings.
  • The algorithm of thermal calculation takes the heat balance monthly to the German standard DIN V 18599, equivalent of the international standard ISO 13790
  • Contacts: New Roman, Volker Coors (HFT Stuttgart)

Project Sunshine

  • Beauty (English link requires a recent version of java)
  • Thermal calculation algorithm takes the monthly heat balance of the international standard ISO 13790
  • Coordinator: Raffaele Amicis (Fondazione Grapitech)

Energy Atlas Berlin


Solar energy potential

One of the oldest applications of 3D city models is the study of solar potential (also called solar atlas, or even solar cadastre), precisely calculating the incident solar energy on each slope of roof and façade of the buildings and urban infrastructure.

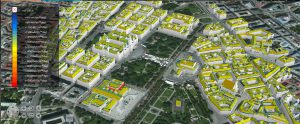
Solar atlas in the center of Vienna - source: project iScope

Solar atlas in the center of Vienna – source: project iScope

From a certain threshold of solar annual received, a roof or façade can provide cost-effective support for the installation of thermal solar panels or photovoltaic. The identification of these surfaces and the estimation of renewable energy that can be produced there is an essential step of a climate Plan energy territory. Many cities have put this information online via a web – GIS (usually 2D, sometimes 3D).

The algorithms are based on models of sky (Perez, Hai etc.) and solar radiation (radiosity, ray tracing, etc.). They usually take into account interactions with the adjacent buildings (shadow and reflection), reliefs and the surrounding vegetation.

Prerequisites: city 3D model LoD2 (at least), model of distant land in the event of important reliefs. Possibly information of vegetation.

Initiatives & contacts

Project iScope

Berlin Solar Atlas / Energy Atlas Berlin

  • Main partners: YOU Berlin, town of Berlin, VirtualCitySystems
  • Beauty (English link)
  • Contact: Till Belusa