Urban planning and architecture

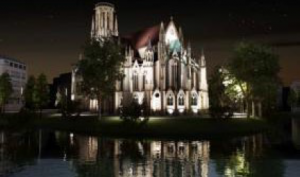
3D city models provide a realistic city visualization as it is currently, or as it could be due to a new urban development project. They skillfully juggle overviews and zooms immersing the user in the streets, rooftops, embedded in this virtual city such a video game in the first person.

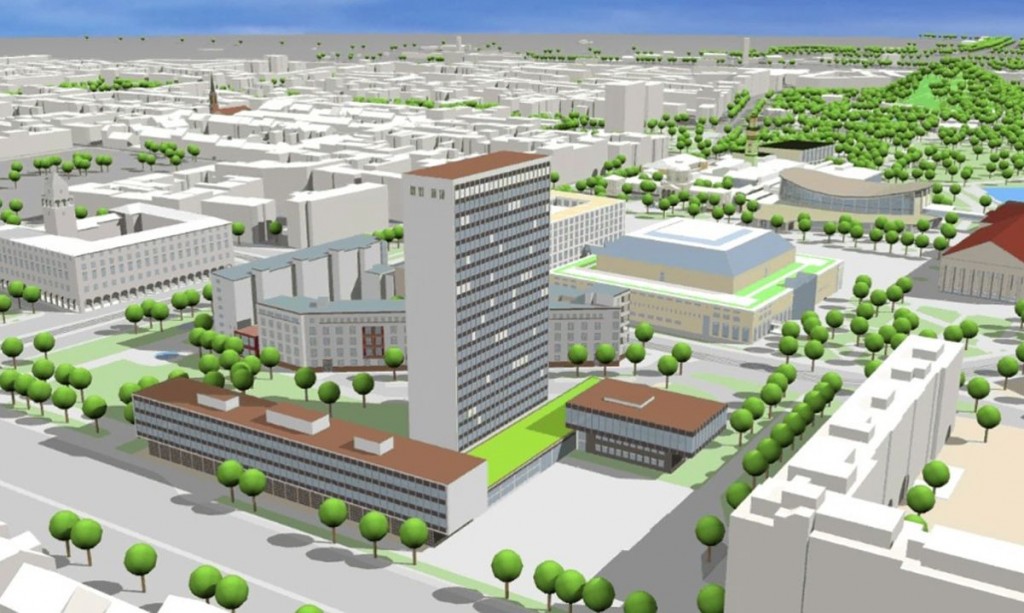
CityGML visualization – source: ArcGIS blog

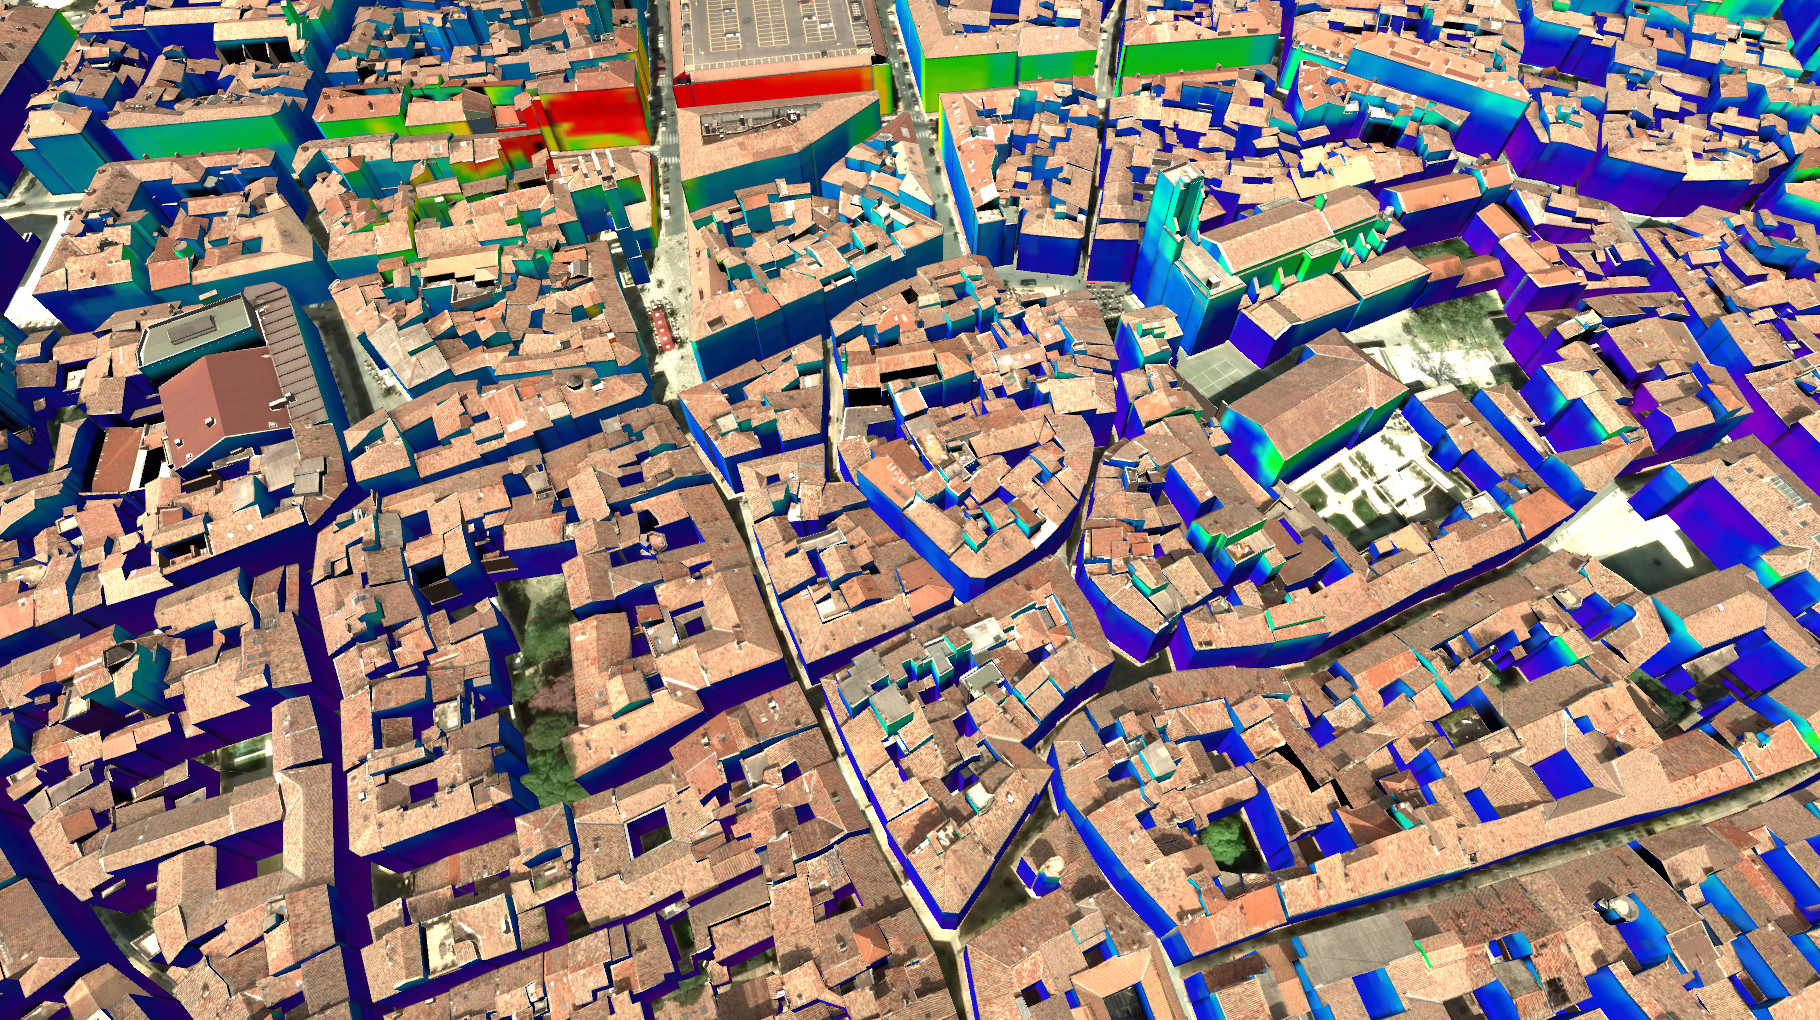
Thanks to the different levels of Detail, it is possible to visualize the different steps of the new urban project, the ground plane (LoD1) detailed design (LoD4). The cadastre can be precisely managed, 2D or even 3D in the case of building overlapping infrastructures or other buildings. Thus a space envelope, such a giant virtual container, can be set before each build, delimiting the grip to the ground, the height and shape of the building to be built. Based on simulations of shadow and sunshine, this envelope can also have the aim to control the impact of a new building or block on the adjacent buildings in terms of access to the Sun. The same concept can be developed with studies of visibility (view on the sea, on a historical monument etc.).

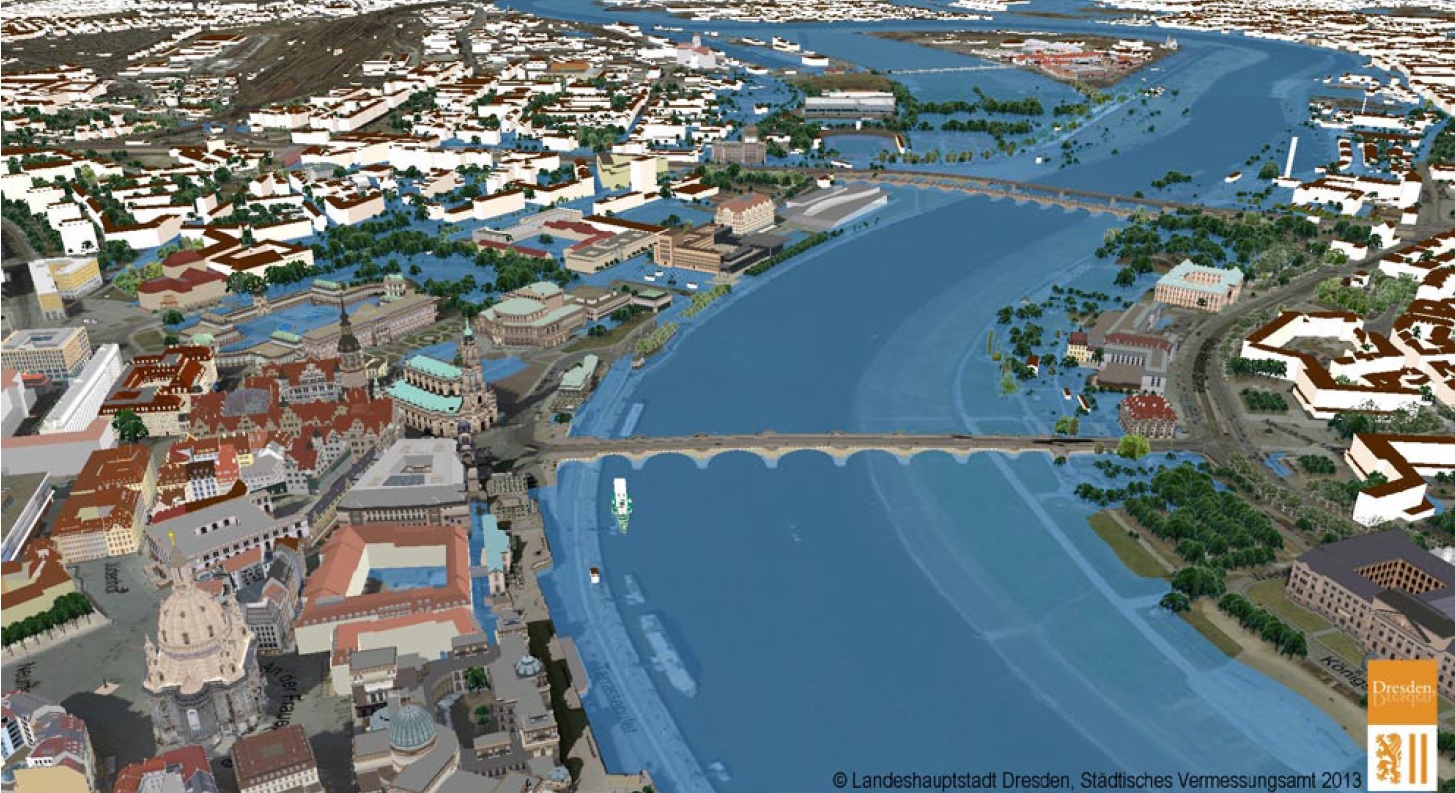
Working on the same digital urban model, communication between the developer, the lessor and the architect is fast and seamless. Similarly, those affected by the new urban development project can involved in the process of reflection and acceptance, having in front a very realistic impression of what awaits them.

Life Cycle Analysis of neighborhoods

The city is a mix of buildings renovated, old, new, already shaved or to be built. At any given time will always question, is it better, shaved and rebuild, or build on a vacant? The analysis of Cycle of life (ACV) provides part of the answer in terms of environmental impact.
 
LCA quantifies the environmental impacts of any product generally, extraction of contents to the elimination of its waste, according to different criteria such as the CO2 emissions or waste (detailed in the ISO 14040 standard definition). Applied to the neighborhoods, it allows to measure the impact of urban or architectural choices on the environment during the four phases of the life cycle of the District:

  • construction (extraction of raw materials, production and transport of materials),
  • use (heating, lighting, water consumption, etc.).
  • renovation (replacement of components: windows, insulation, coverings of buildings and streets).
  • and demolition (transport and waste treatment).Life cycle of a building - source: inspired by hqe

    Life cycle of a building – source: inspired by hqe

 Note that the environmental performance of a neighbourhood is not simply the sum of the balance sheets of the various buildings that make it up. Indeed, it must take into account the interactions between buildings, whether at the level of the solar masks, energy systems shared etc. We must also consider the relationship between the neighborhood and the rest of the city, or even the region, either regarding media (performance of the water supply network, potential heat network, drinking water and wastewater, etc.), transport (roads, trails, transportation systems, etc.), waste management (landfill, incinerator, recycling plants, energy recovery potential, etc.) , climate, different sources of electricity generation, heat, local supply chains in fuel like wood, (bio) – gas etc.
 
Data features in the area necessary for the realization of his ACV can be largely extracted and stored in the 3D city models: date of construction/renovation/demolition, use of buildings, geometry and materials of construction etc. These data will be generally crossed to typologies of buildings as well as databases of materials and processes (ecoinvent etc.).

Prerequisite: Model of 3D city (LoD2 or more), construction, renovation, given data macros at the level of the region (energy mix, etc. supply chains)

Initiatives & contacts

ZAC Claude Bernard in Paris

  • http://www.erudit.org/Revue/eue/2011/V5/n/1007605ar.PDF


Electromagnetic exposure and wireless network coverage

3D city models to simulate the spreading of electromagnetic waves in urban areas, and thus accurately plan the deployment of telecommunications (mobile telephony, wifi) wireless networks.

Electromagnetic field exposure in Nîmes - source: Siradel

Electromagnetic field exposure in Nîmes – source: Siradel

Based on geostatistical data (ex: use of transport, data of consumption) and demographic (ex: number and average age of the residents and workers of the district), the hotspots for the use of these networks can be predicted, to optimize the coverage of the networks.

In parallel, the exposure of populations to these electromagnetic waves can be objectively calculated in all urban areas, outside as well as inside buildings. So, some base stations can be moved, in order to minimize electromagnetic pollution near the most vulnerable places (crèches, schools etc.).

Prerequisite: Model city LoD1 3D, positioning of base stations.


Initiatives & links

Siradel company

Brussels environment

  • Atlas environment: 3D Simulation of the electromagnetic field (webgis)


Artificial lighting studies

The night lights of the monuments have always mixed art and technique. A nocturnal image original and custom can be modelled by playing on the positioning of the lumieuses sources, the effects of shading, lighting levels and color temperatures.

Simulation of lighting in Stuttgart - source: InGeoForum

Simulation of lighting in Stuttgart – source: InGeoForum

Previously, this garment of light was obtained groped by comparing some variations in real conditions during the planning phase. Now, software using the 3D building and city models allow to explore many illumination to the particularly realistic scenarios. The actual physical data such as the coefficient of reflection of the facades, light sources and their dispersion are specifically taken into account. As the creation and optimization of lighting is entirely computer-aided, work and night alterations on site are minimized.

The light based on 3D city models simulation applies not only to the historical heritage but can affect all public lighting in general. Whether to add street lights in dark places such as crime prevention, or rather reduce light pollution to promote biodiversity and incidentally save energy, simulate these different scenarios by adjusting virtual light sources to make economies of scale by directly getting results on the ground.

Prerequisite: Model of 3D city LoD3 with texture, terrain and vegetation

Flood risk analysis

Using digital city model integrating a terrain model (DGM) as well as data concerning the drainage network, it may be virtually tested in the case of heavy rain or a significant flood.
 Simulation of flood in Dresdre - city of Dresdre

Simulation of flood in Dresdre – city of Dresdre

These dynamic simulations allow to predict the damage caused by floods, test preventive measures, optimize the features of drainage (dikes, dams, Pumphouse etc.) and organize relief and evacuation of the premises as appropriate.
 
Prerequisites: Model town 3D (at least LoD1) including a terrain model of high resolution as well as data on the drainage system of the waters and the histories of heavy rain and flooding of the centuries.

Initiatives & contacts

Web3D Interface

Energy transition planning

3D city models provide great tools to coordinate the different actors and initiatives around energy transition.

Consumption of the buildings of the city of Ferrara - source: Project Sunshine

Consumption of the buildings of the city of Ferrara – source: Project Sunshine

They allow to compare and choose the best low-carbon strategies and then monitor their progress over the years to achieve the ultimate goal: carbon neutrality by 2050 for the France and 21 other countries (roadmap approved at the COP22).

Based on these models, the decision makers have in their hands a series of simulations and analyses interconnected, useful for each phase of the energy transition plan:

These analyses that apply to urban, or even regional, have a very fine granularity (each building is individually modeled realistically) and particularly reliable results if the data used are of good quality. This makes it possible to meet considerations macro (plan to scale of the neighborhood or the city, changing the energy mix) and micro (individual housing renovations, solar panels on the roof, the heating network connection).

For energy transition, the result as important as the way to achieve it. Especially for scenarios of energy renovation of buildings, the impact of different renovation rate (percentage of buildings renovated annually) as well as different priorities of renovation (depending on age, consumption of heat, the potential energy of the building, or of energy poverty) can be compared.

Finally, acceptance and involvement in this reflection of different urban actors, whose populations, is essential. Different collaborative tools to become immersed in these 3D city models and thus visualize the energy transition can be used: touchtable, 3D, etc. augmented reality web interface

Prerequisite: Model town 3D (LoD2 at least), data on the energy state of the buildings and systems.

Initiatives & contacts

Territory of the County of Ludwigsburg climate energy plan

  • Klimaschutzkonzept (map energy climate territory) of the 32 municipalities of the County of Ludwigsburg (500,000 inhabitants)
  • Partners: HFT Stuttgart, Drees & Sommer, Landkreis Ludwigsburg
  • Contacts: Volker Coors, New Roman (HFT Stuttgart).

Rotterdam:

  • Estimated needs of heat and CO2 emission scenarios of renovation of ~ 1000 buildings of the district Bospolder of Rotterdam (report).
  • Partners: HFT Stuttgart, City of Rotterdam
  • Contacts: New Roman, Volker Coors (HFT Stuttgart)

Optimized layout and sizing of district heating/cooling networks

The urban heating network extension or planning process usually begins with an analysis of the potential of heat need. Follows the route of the network generally to rule along main streets. Then comes the concept of heat production which will cover the needs (with a comfortable overdesign factor), to finish on optimization at all and in particular costs.layoutnetwork2

This process (almost) – Centennial is still very fragmented, mixing calculation tools very various, management of "semi" data, decisions to the wet finger based on experience. CEL in addition to strangers such as: what proportion of households will connect to the network? What proportion of buildings will be renovated (and will therefore see their need of heat declined drastically) the next years? The application of heat will be always strong enough along the network? Because of this complexity, operators of heating network is limited to city centres, if possible close to buildings energy efficient, to ensure their profitability. While several projects have proved their profitability to connect neighborhoods of low-energy and passive houses.

The 3D city models represent a new generation of tools for planning, more automatic and integrated than the traditional method, able to find optimum solutions to the problems.

City CityGML models include in particular models of buildings, land and underground, transport (if not importable from openstreetmap) and soon the models of urban networks (Thematic Module UtilityNetwork coming in the new version of CityGML 3.0). 3D allows to precisely model the path of the network in the basement, taking into account the other underground networks as well as the local geology.

By combining thermal needs geo-localized calculated precisely for each building, a digitized street map and a few parameters cost and constraints of felt (for a slice along a street, the route of a private field or a cellar etc.), and by turning the whole with a graph theory algorithm coupled with a software professional sizing and simulation of heat networks , it will be possible to generate automatically a trace and dimensioning of heating network optimized. From there, many variations are possible: simulation of different rates of connection, of different scenarios for building renovation, intensification in the medium term, criteria for connection etc… the possibilities are endless.

Prerequisite: 3D city model LoD1/LoD2, model field, data network if existing (plan, temperature etc…)

Initiatives & contacts

SIMSTADT, urban energy simulation platform

Platform AixLib (Germany)

  • Developer: RWTH Aachen – E Research center
  • Contact: Moritz Lauster

Urban heat island and microclimate analysis

Urban forms, surface materials, the presence of vegetation and water bodies, and the concentration of human activity have a real influence on the urban microclimate. In particular, the dense urban morphologies are "traps for solar and thermal radiation" while the surfaces of the frames absorb and store some of this energy.

Screenshot software CitySim - source: Kaemco

Screenshot software CitySim – source: Kaemco

This microclimate is more often characterized by higher temperatures in the Center cities than on their outskirts, called urban heat island phenomenon. In the winter, so these are milder temperatures and thus consumption of heating lower than in rural areas, but also of the peaks of heat stressed in the summer, sometimes suffocating. More than just a source of thermal discomfort for city dwellers, urban heat island is moving to the center of political and social concerns, in order to limit the health impacts of heat waves that should multiply in temperate zones in the coming years according to the IPCC.

Accurately predict the micro-climates linked to new urban developments is therefore crucial. Take into account all aspects and their interactions requires a combination of quite comprehensive and complex physical models (models thermo-radiatifs, air, évapo-transpiratifs and anthropogenic effects). These are based on the 3D geometry of the buildings, their construction materials and its mode of occupation, but also data on their environment, vegetation, soil, human activity (especially transport) etc… all data that can deliver city CityGML models.

Schematic Cup of visualization of temperatures in 2008 for a night of heat - source: Group DESCARTES

Schematic Cup of visualization of temperatures in 2008 for a night of heat – source: Group DESCARTES


Initiatives & contacts

SOLENE, development of a tool for simulations of the urban microclimate platform.

CITYSIM, urban energy simulation software

Simulation and prevention of explosion in urban areas

The 3D simulation of a Shockwave in a digital city model to predict the impact of an explosion in urban areas.

Simulation of explosion in the center of Frankfurt - Source: VirtualCitySystems

Simulation of explosion in the center of Frankfurt – Source: VirtualCitySystems

These simulations to identify sensitive urban areas where a bomb of 2nd forgotten war, the explosion of a gas pipeline, or a criminal explosive device would cause significant damage on the people and the surrounding buildings.

The goal is also to prepare and test if the evacuation of the site, its security and coordination of the first aid.

Prerequisites: city 3D model (at least LoD1), data of construction of buildings and location of sensitive places

Initiatives & contacts

Project Detorba (2013-2015, Germany)

Simulation of transport and missions

3D city models provide a level playing field true to reality for transport simulators (fire, ambulance, military etc.), who train the staff to various scenarios of missions. These simulators allow their user to deepen the knowledge of places of mission and prepare them to react to difficult circumstances (weather, congestion or accident of transport etc…). They also test and compare with the professionals of new measures (extension of transmission line, new road signs etc…) before applying them in the field.

Berlin tram Simulator – source: Berliner Verkehrsbetriebe AG

Each level of detail for 3D city models are its application: LoD1 will be reserved for flights and ships, simulators while LoD2 and LoD3 will be adapted to transport and outdoor environment simulators. For training interventions within buildings (firefighter, military etc.), a LoD4 will be necessary.

Prerequisite: Model town 3D (application-dependent LoD) and of land including transport, vegetation, and dynamic models (people and vehicles)

Initiatives & contacts

Rheinmetall Defence Group