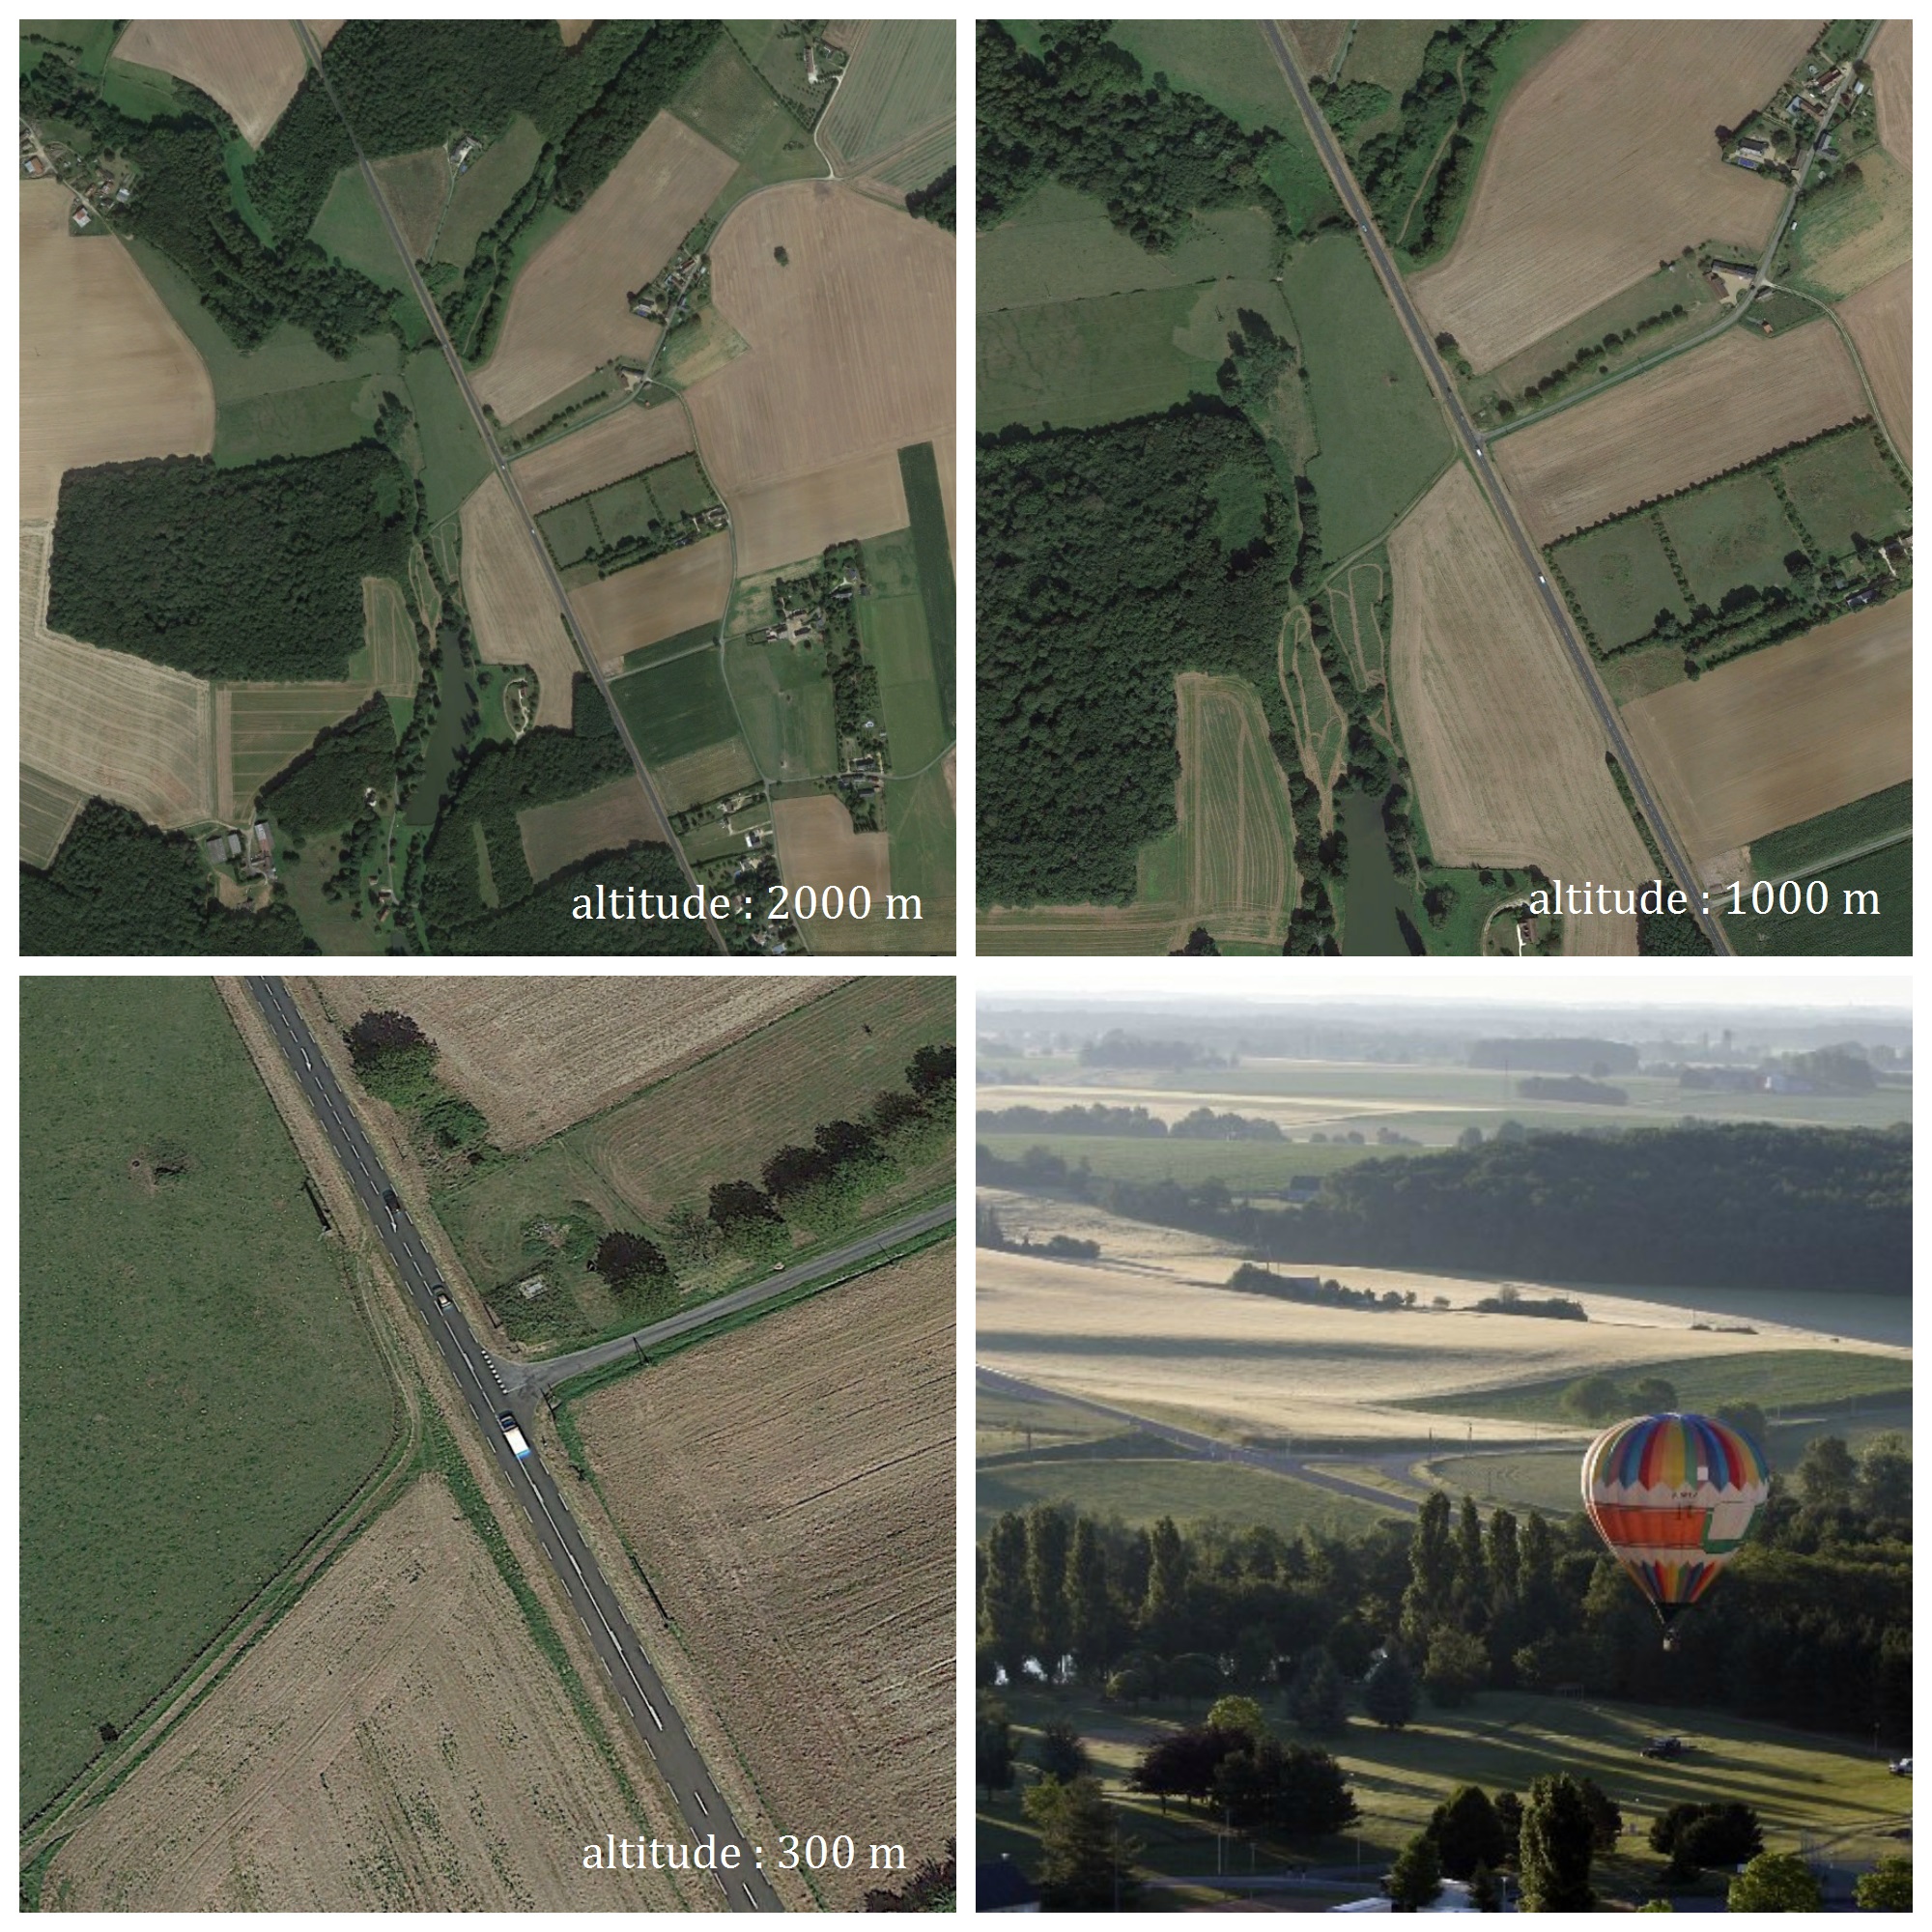
Imagine that you fly in a balloon. You are at an altitude of 2000 metres, a vast landscape spreads before your eyes. Below, you can see small geometric shapes as well as long lines corresponding to fields and roads. Then you go down to 1000 meters, and you realize that roads are too wide, and that "points" are moving slowly on.
Get off again, now at an altitute of 300 meters, you are right on the top of a crossroads, you can now see the 2 channels of each road, and then the white stripe of the stops. The points became separate cars that stop to give way.
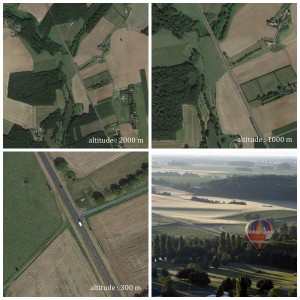
Aerial views in a balloon
At 50 meters from the ground, you see even by the glass roof the two occupants from one of these cars. You have however lost the big picture that you had when the balloon was higher.
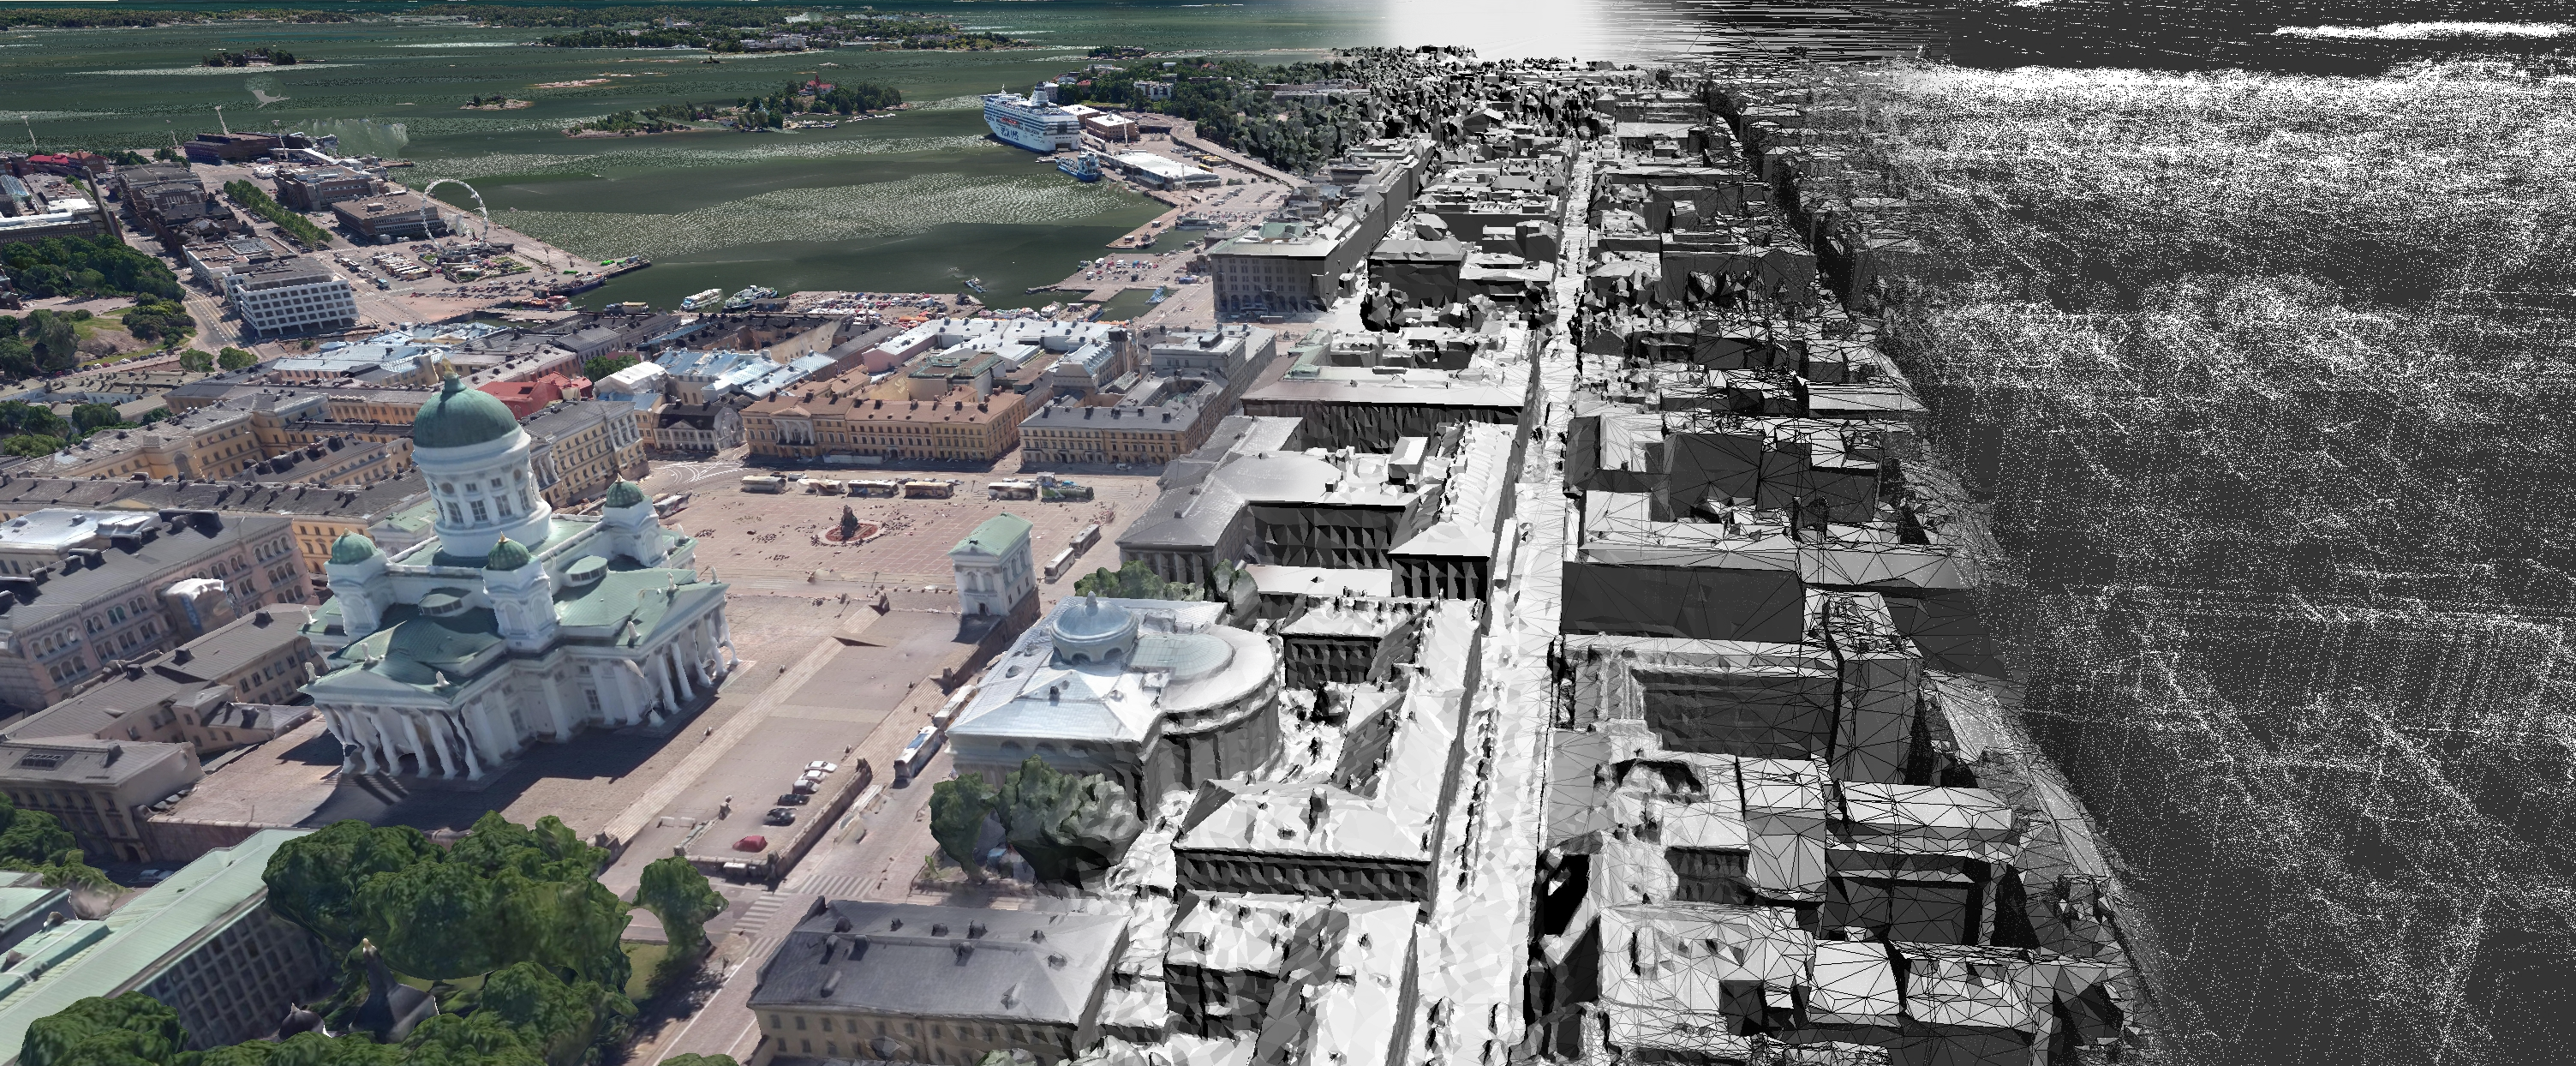
That experience faithfully illustrates the concept of levels of detail (Levels of Detail in English, which the LoD acronym is often used), one of the basic concepts of digital city models.
The LoD are used to define the different representations of an object from the real world. They are a kind of cursor between detailed overview and focus.
In existing neighbourhoods, the LoD to adapt the digital model to the availability and resolution of the data collected. For example, it is impossible to model the shape of the roof of a building, if only its cadastral data are known. Several LoDs can coexist in a single digital model of city, to represent various buildings modeled with various resolutions.
The concept of LoD is also very useful for the new urban projects. In such a case, the altitude corresponds to the different phases of the development of the project: it starts with a ground plan of the firm urban planners defining the footprint and the average heights of buildings), then comes the conceptual design fixing the form of the buildings, and finally the detailed design specifying the different architectural and technical elements as well as domestic.
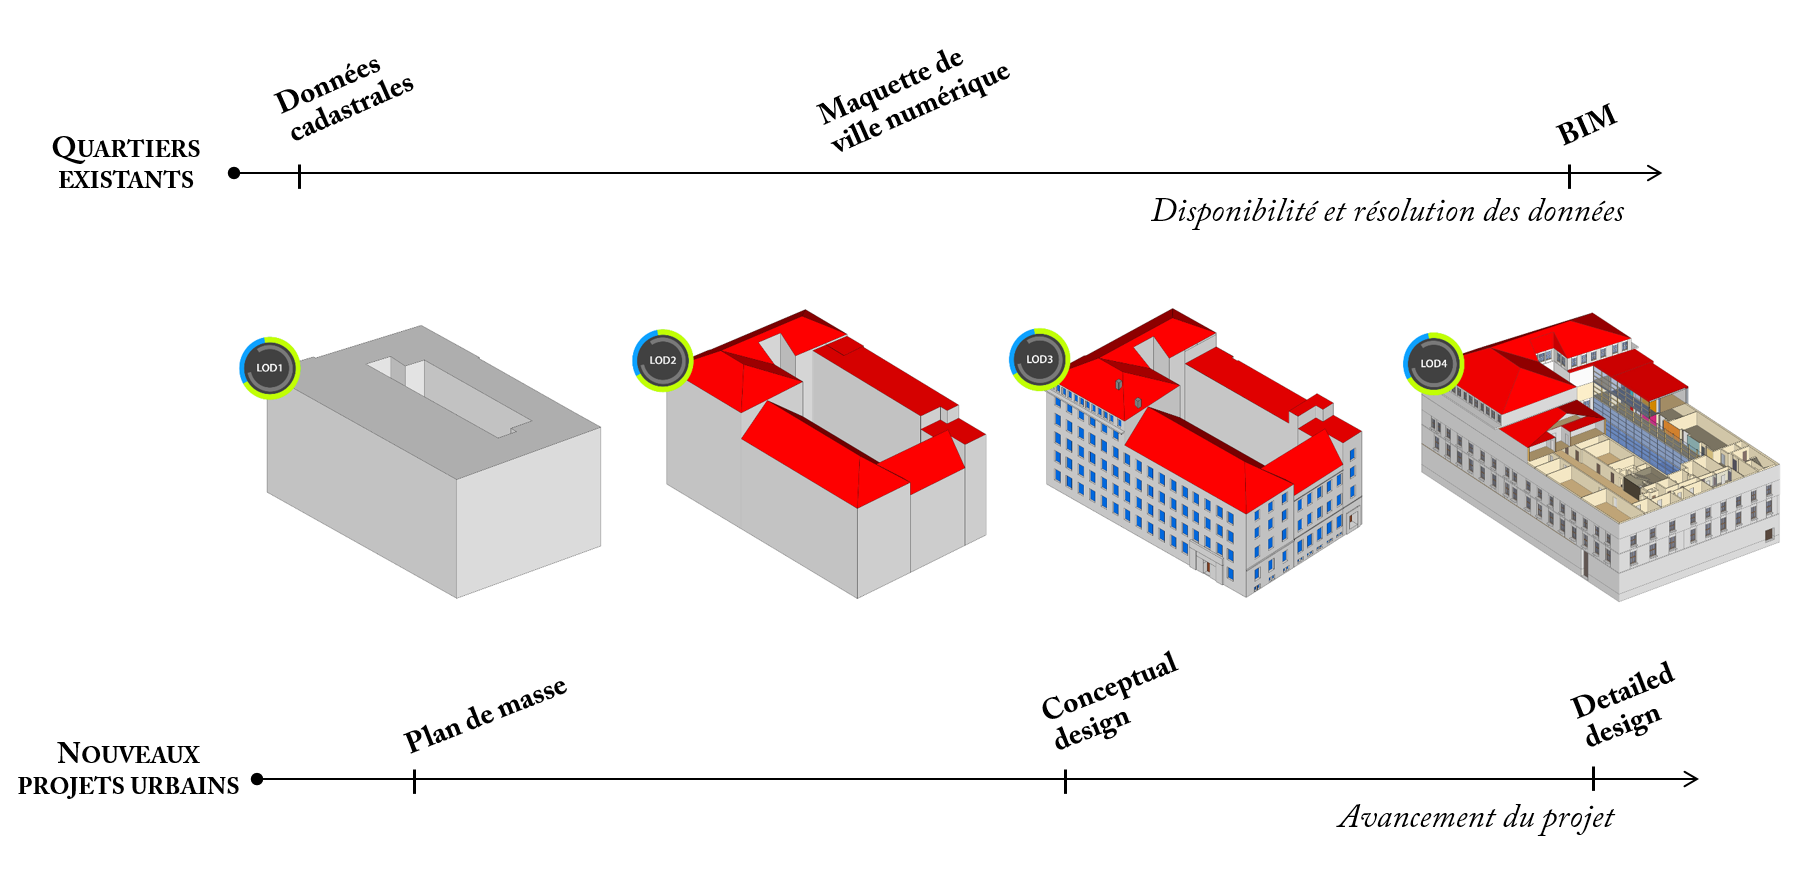
2 HFT Stuttgart building represented in 4 levels of detail CityGML
Levels of detail are used and defined in many standard of the building (IFC) and the city (Blom3D, Navtek) modeling, based on various factors (geometry, semantic, texture, type of objects). In the open standard digital city CityGML, detail levels are 5 (LoD0 to the LoD4), defined mostly by the complexity of their geometry (detail of roof, openings, inside):
- LoD0 included fieldwork and the footprint of the buildings (often called 2.5 D model)
- LoD1 models buildings like the boxes to cardboard, consequence of the extrusion of their surface on ground until their average height
- LoD2 adds the roof structure
- LoD3 details the position of the openings (windows and doors) on the facades and roofs and the potential structural and architectural exteriors (balcony, pre-toit)
- LoD4 finally introduced inside the building (equivalent to BIM) modeling
The texture of urban objects is independent of the LoD in CityGML, even if it takes its meaning from the LoD2.
The freeware Random3DCity developed in Delft (Netherlands) by Filip Biljecki allows to automatically generate models of city synthetic mixing these different LoD based on different criteria (density of construction etc.).
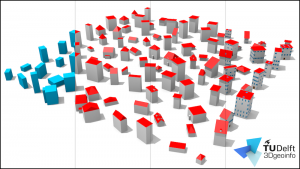
Software Random3Dcity, mixing LoD1 to LoD3 – source – TU Delft
It is interesting to consider these levels of detail based on their purpose, i.e. of their potential application to different urban analysis.
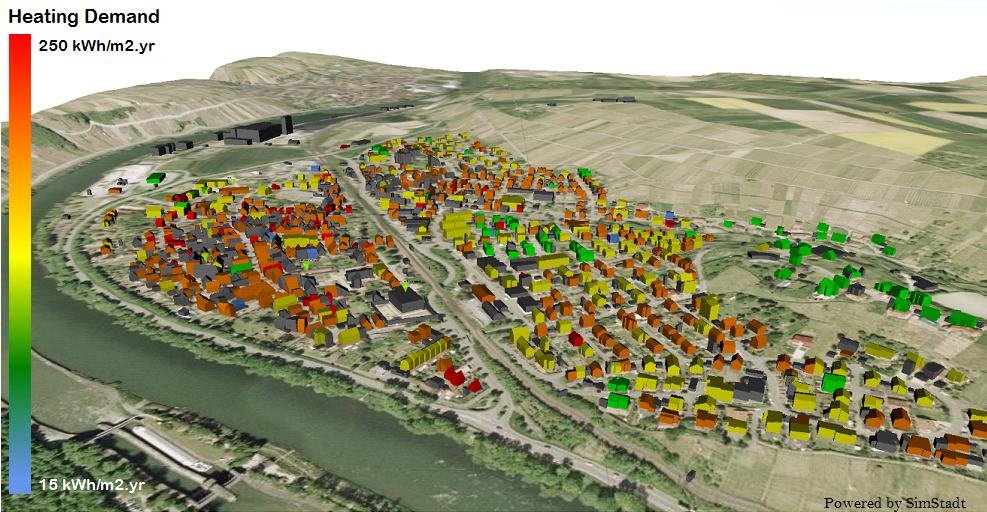
A digital model of city LoD1 will be more than enough for a mapping of noise, when a LoD2, which models the actual shape of the roofs, will be needed for a study of the potential solar and photovoltaics. Applications requiring the Interior configuration of the buildings (natural lighting, indoor navigation, etc.) will make them call for a LoD4. For modeling of heat of a building needs, a LoD1 will provide the minimum information, however the choice of a higher LoD (LoD2, or even LoD3 and LoD4 for multizone modeling) will impact on the accuracy of the results, in particular refining the calculation of solar gains and the distribution of heat transfer. Several studies have quantified this precision gain related to the LoD on concrete cases (LoD1/LoD2 5% for[Nouvel et Zirak], x % for…). Note that the quality of simulation data, and therefore the accuracy of the results, is not that of the LoD, but also the quality of semantic data.
The consistency of these levels of detail has been questioned in recent years, due in particular to the fact that they consider only the geometric complexity and semantics.
LoDs alternatives, based on a more consistent combination of level of detail geometric and semantic have been put forward.