3D city models provide great tools to coordinate the different actors and initiatives around energy transition.
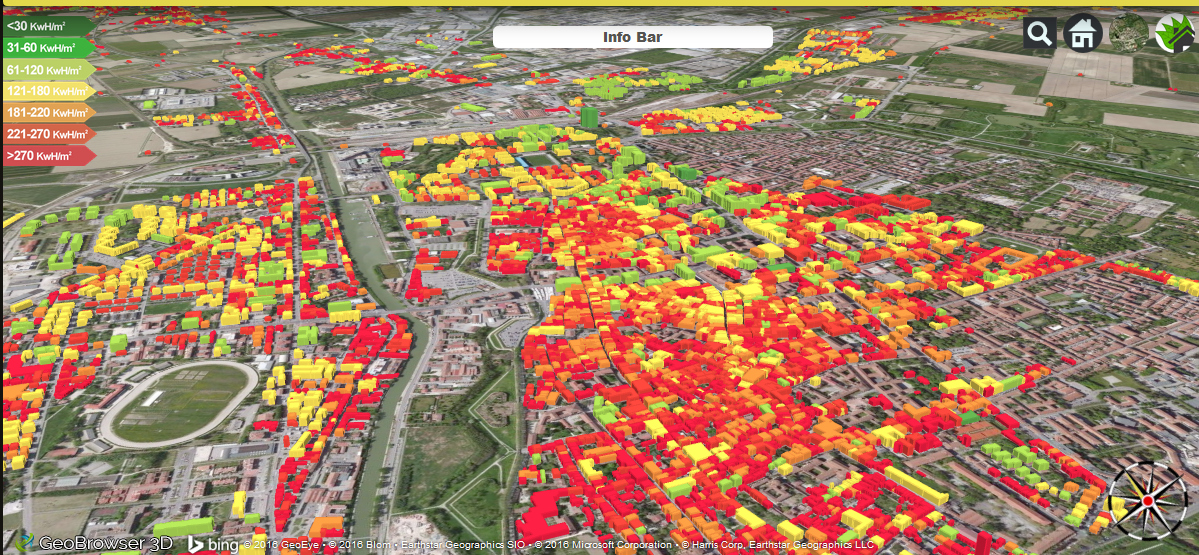
Consumption of the buildings of the city of Ferrara – source: Project Sunshine
They allow to compare and choose the best low-carbon strategies and then monitor their progress over the years to achieve the ultimate goal: carbon neutrality by 2050 for the France and 21 other countries (roadmap approved at the COP22).
Based on these models, the decision makers have in their hands a series of simulations and analyses interconnected, useful for each phase of the energy transition plan:
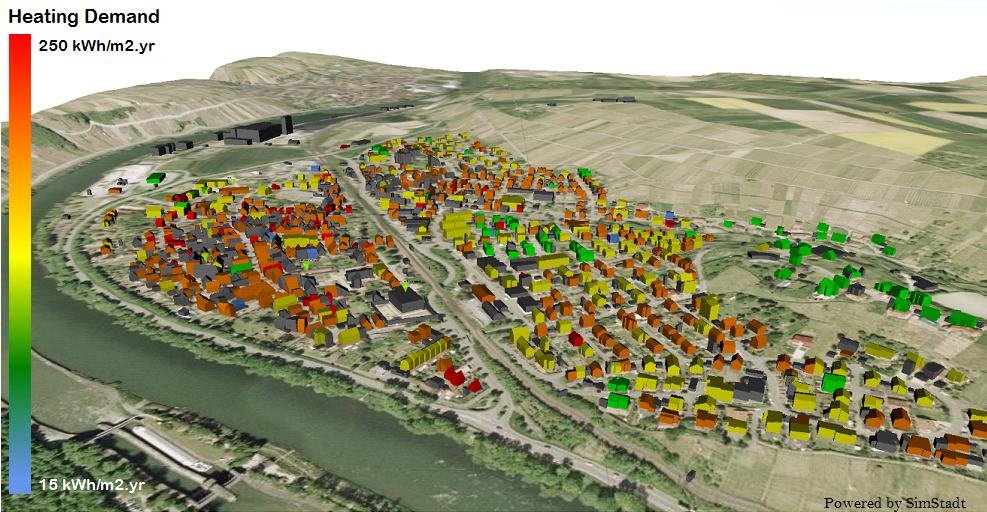
- Diagnostic predictions of energy savings and thermal needs related to the renovation of the buildings.
- identify the potential of solar energy
- integration of renewable energies,
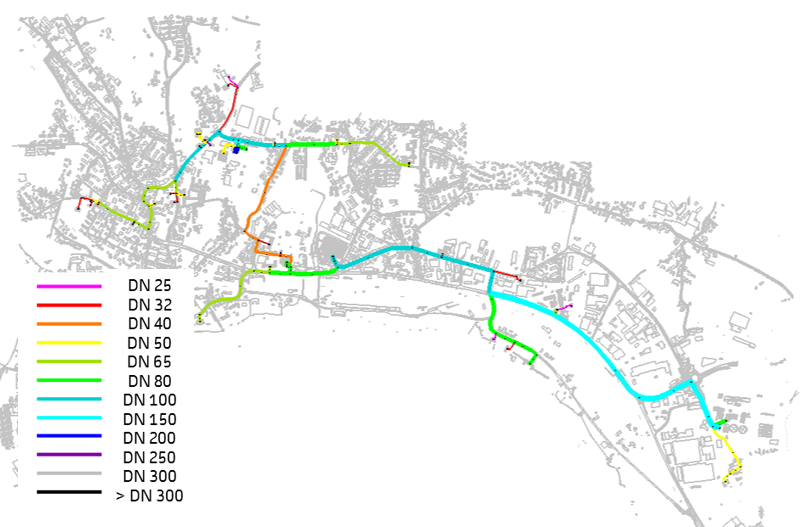
- comparison of centralized and decentralized energy systems,
- calculation of consumption and grey energy, CO2 emissions
- estimated costs (investment and overall costs).
These analyses that apply to urban, or even regional, have a very fine granularity (each building is individually modeled realistically) and particularly reliable results if the data used are of good quality. This makes it possible to meet considerations macro (plan to scale of the neighborhood or the city, changing the energy mix) and micro (individual housing renovations, solar panels on the roof, the heating network connection).
For energy transition, the result as important as the way to achieve it. Especially for scenarios of energy renovation of buildings, the impact of different renovation rate (percentage of buildings renovated annually) as well as different priorities of renovation (depending on age, consumption of heat, the potential energy of the building, or of energy poverty) can be compared.
Finally, acceptance and involvement in this reflection of different urban actors, whose populations, is essential. Different collaborative tools to become immersed in these 3D city models and thus visualize the energy transition can be used: touchtable, 3D, etc. augmented reality web interface
Prerequisite: Model town 3D (LoD2 at least), data on the energy state of the buildings and systems.
Initiatives & contacts
Territory of the County of Ludwigsburg climate energy plan
- Klimaschutzkonzept (map energy climate territory) of the 32 municipalities of the County of Ludwigsburg (500,000 inhabitants)
- Partners: HFT Stuttgart, Drees & Sommer, Landkreis Ludwigsburg
- Contacts: Volker Coors, New Roman (HFT Stuttgart).
Rotterdam:
- Estimated needs of heat and CO2 emission scenarios of renovation of ~ 1000 buildings of the district Bospolder of Rotterdam (report).
- Partners: HFT Stuttgart, City of Rotterdam
- Contacts: New Roman, Volker Coors (HFT Stuttgart)